The Logic Roadmap: Master Flowcharts and Algorithms in Programming
Have you ever tried to assemble a complex piece of furniture without looking at the manual? You might get lucky and end up with a shaky chair, but more often than not, you’re left with a handful of “extra” screws and a lot of frustration. Programming is no different. Jumping straight into your code editor without a plan is the fastest way to get lost in a sea of bugs.
This is where flowcharts and algorithms come into play. They are the blueprint and the instruction manual for your code. Before a single semicolon is typed, professional developers use these tools to visualize logic and ensure their solution actually works.
In this comprehensive guide, we are going to demystify these two essential concepts. We’ll explore how to translate human ideas into logical steps, the universal symbols that make flowcharts work, and why mastering this planning phase will make you a ten-times better programmer. Whether you are a student or a self-taught enthusiast, by the end of this article, you will see your code as a clear, navigable roadmap rather than a confusing maze.
What are Flowcharts and Algorithms?
Let’s start with a clear, grounded definition of our two stars.
What is an Algorithm?
An algorithm is a finite sequence of well-defined, computer-implementable instructions, typically to solve a class of specific problems or to perform a computation. In simpler terms: it is a recipe.
Just as a recipe tells you to “crack the eggs” and then “whisk for two minutes,” an algorithm tells the computer exactly which data to take and what transformation to apply to it. Every piece of software, from the simple alarm on your phone to the complex recommendation engine on Netflix, is essentially a massive collection of algorithms.
What is a Flowchart?
A flowchart is a visual representation of an algorithm. It uses standardized shapes connected by arrows to show the “flow” of data and logic. If the algorithm is the written text of the recipe, the flowchart is the step-by-step infographic on the back of the box.
Why are Flowcharts and Algorithms Important?
You might think, “I can hold the logic in my head, why bother drawing it out?” Here is why even the most experienced senior engineers still reach for a whiteboard or a piece of paper:
1. Visualizing Complex Logic
Human brains are great at creative thinking but terrible at keeping track of 50 different “if-else” conditions at once. A flowchart allows you to see the entire logic tree simultaneously. You can spot dead ends or infinite loops visually before they ever become broken code.
2. Universal Communication
Code can be hard to read, especially if you’re using a language your teammate doesn’t know. However, a flowchart is universal. You can show a flowchart to a project manager, a client, or a fellow developer, and everyone will understand the process flow regardless of their technical background.
3. Debugging Before the Bug
It is much cheaper and faster to fix a logic error on a diagram than it is to fix it in a production-ready application. Planning with flowcharts and algorithms helps you catch “edge cases”—those weird situations where a user might enter something unexpected—before they cause a system crash.
Core Concepts Explained: Step-by-Step
To master flowcharts and algorithms, you need to understand the building blocks used to construct them.
The Anatomy of an Algorithm
Every good algorithm shares three characteristics:
- Input: It takes some data (like two numbers to add).
- Process: It performs a specific action.
- Output: It provides a result (the sum of those numbers).
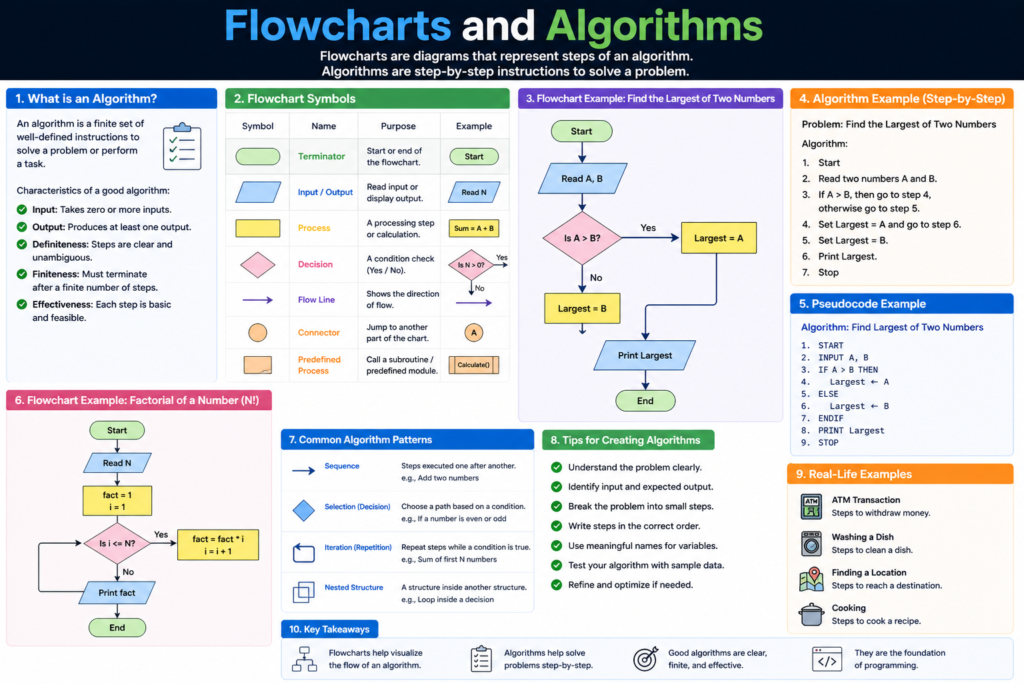
The Language of Flowcharts
To keep things organized, we use specific shapes for specific tasks:
- Oval (Terminator): Represents the Start and End of a process.
- Rectangle (Process): Represents a specific action, like x = x + 1.
- Diamond (Decision): This is where you ask a “Yes/No” or “True/False” question.
- Parallelogram (Input/Output): Represents getting data from a user or displaying a result.
- Arrows (Flow Lines): Shows the direction the logic is moving.
💡 Pro Tip: Always keep your flowcharts moving from top to bottom or left to right. This makes them much easier for other humans to read!
Practical Examples: From Recipe to Code
Let’s look at a real-world scenario: Deciding if you should wear a coat.
The Algorithm:
- Start.
- Check the outside temperature.
- If the temperature is less than 15°C, put on a coat.
- Else, if it’s not cold, just wear a t-shirt.
- End.
The Flowchart:
The Code (JavaScript):
let temperature = 12;

if (temperature < 15) {
    console.log("Put on a coat!");
} else {
    console.log("A t-shirt is fine.");
}
Do you see how the diamond in the flowchart directly maps to the if statement in the code? This 1:1 relationship is why planning is so powerful.
Common Mistakes to Avoid
- Missing the “Stop” Point: Every algorithm must have an end. If your flowchart loops back on itself without an exit condition, you’ve just designed an infinite loop, which will crash your program.
- Vague Instructions: “Calculate the result” is a bad step. “Add tax (15%) to subtotal” is a good step. Be specific!
- Ignoring the “No” Path: Beginners often draw the “Yes” path for a decision diamond but forget what happens if the answer is “No.” Every decision must have two exits.
- Starting Too Big: Don’t try to flowchart an entire social media app at once. Flowchart one small feature, like the “Login” button.
Pro Tips & Best Practices
- Use Pseudocode First: If you aren’t ready to draw shapes, write your algorithm in “Pseudocode”—a mix of English and code logic. It helps bridge the gap.
- Keep Symbols Consistent: Don’t use a circle for a process; stick to the standard rectangle. It makes your work professional.
- Test Your Logic on Paper: Before you code, take a sample piece of data and “walk” it through your flowchart with a pen. Does it reach the correct end?
- Tools of the Trade: While paper is great, tools like Lucidchart, Draw.io, or even Excalidraw are fantastic for creating digital, shareable flowcharts.
Real-World Use Cases
1. Banking and Finance
When you swipe your card, a complex algorithm determines if you have enough funds, if the transaction looks like fraud, and if the currency needs conversion—all in milliseconds. Flowcharts are used here to ensure no security steps are skipped.
2. Self-Driving Cars
An algorithm constantly processes data from cameras. “If object detected within 2 meters -> Apply brakes.” These logic trees are incredibly deep and require rigorous flowcharting to ensure safety.
3. E-commerce Shipping
How does Amazon know which warehouse is closest to you? An algorithm calculates the distance, the stock levels, and the shipping speed to give you that “Arriving Tomorrow” promise.
Mini Project: Build a “Login Validator” Logic
Imagine you are designing the logic for a login screen.
The Logic Challenge:
- Input: User enters username and password.
- Decision 1: Is the username field empty? (If yes, show error).
- Decision 2: Is the password longer than 8 characters? (If no, show error).
- Process: Check the database.
- Output: “Access Granted” or “Access Denied.”
Try drawing this! Use an oval for Start, a parallelogram for the user input, diamonds for the checks, and another oval for the end. Once you have the diagram, writing the actual code becomes a simple task of “filling in the blanks.”
Frequently Asked Questions (FAQs)
1. Do I need flowcharts for simple programs?
For a “Hello World” program? No. But the moment you have a decision (if/else) or a repetition (loop), a quick sketch will save you time.
2. Is an algorithm the same as a computer program?
Not quite. An algorithm is the idea or the logic. A program is the implementation of that algorithm in a specific language like Python or C++.
3. What is the difference between a flowchart and a UML diagram?
A flowchart focuses on the step-by-step logic. A UML (Unified Modeling Language) diagram is broader and is used to show the relationship between different parts of a software system (like how different “classes” interact).
4. Can I draw flowcharts by hand?
Yes! Many of the best software architects prefer whiteboards. The tool doesn’t matter; the clarity of the logic does.
5. Why do some flowcharts have different colored shapes?
Color is usually used for organization. For example, all inputs/outputs might be green, while all error-related processes are red. This is helpful for complex diagrams but not strictly required.
Conclusion: The Foundation of Great Software
Mastering flowcharts and algorithms is the true hallmark of an expert programmer. It marks the transition from someone who just “types code” to someone who “designs systems.” By taking the time to plan your logic visually and structurally, you reduce stress, eliminate bugs, and create work that is easier to maintain.
Remember, the goal isn’t just to make the computer understand you—it’s to make the logic so clear that any human can understand it too. So, next time you face a tough coding challenge, put the keyboard aside for five minutes. Grab a pen, draw your diamond, and map out your path to success.
Start practicing now! Pick a simple daily habit—like making coffee—and try to draw a flowchart for it. You’ll be surprised at how many decisions you actually make in a single minute!
Check our next guide on “Mastering Variables and Data Types” to start filling your flowcharts with real data!